admin@hepacleanroomfilter.com
The Relationships between Temperature, Relative Humidity and Relative Saturation.
Because vaporized hydrogen peroxide leaves no residue and is efficient for bio-decontamination in room temperature, it is used widely in applications such as isolators, transfer hatches and in different facilities that require reliable decontamination.
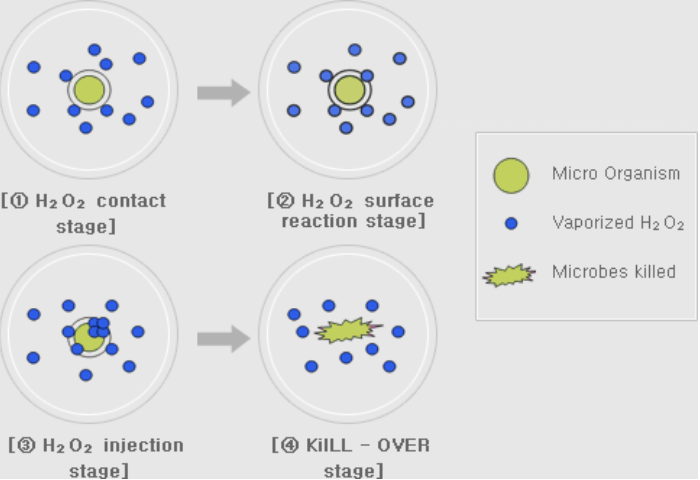
Effective killing of microorganisms can be achieved with different humidity and H2O2 ppm levels. Some manufacturers of bio-decontamination chambers or aseptic isolator prefer subvisible condensation, whereas others prefer dry bio-decontamination processes where humidity is maintained far from condensation. However, dripping condensation should be avoided due to potentially negative effects on aeration time, materials and uniform decontamination efficiency. Therefore, it’s crucial to measure humidity during vaporized hydrogen peroxide bio-decontamination cycles. However, water (H2O) and hydrogen peroxide (H2O2) have a very similar molecular structure. Therefore they both affect the humidity of the air.
Relative humidity by its definition indicates the humidity of the air caused only by water vapor.
Therefore, humidity sensors used in vaporized hydrogen peroxide applications typically use a catalytic layer over a normal humidity sensor. The catalytic layer catalyzes the hydrogen peroxide so that the humidity sensor measures only water vapor. The measured relative humidity indicates the humidity of the air caused only by water vapor. When measuring H2O2 in a vapor state, relative saturation is the parameter that indicates the amount of humidity in the air caused by both hydrogen peroxide and water vapor. The air mixture starts to condense when the relative saturation reaches100 %RS. Relative saturation is the only parameter that indicates when the air mixture with the water vapor and hydrogen peroxide vapor starts to condense. Therefore, it is essential to follow the relative saturation value during the bio-decontamination process.
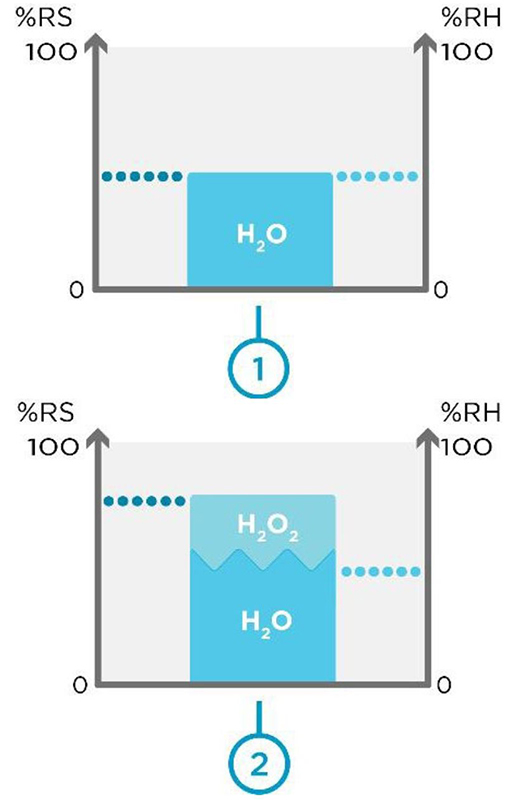
Figure 1. Space 1 without H2O2 vapor and space 2 with H2O2 Vapor.
Figure 1 above shows you two different spaces: Space 1 without H2O2 vapor and space 2 with H2O2 vapor. When H2O2 vapor is not present, relative saturation equals relative humidity. This can be seen in space 1. Within space 2, we have the same volume of air with H2O2 vapor introduced. Now, relative saturation is higher than relative humidity.
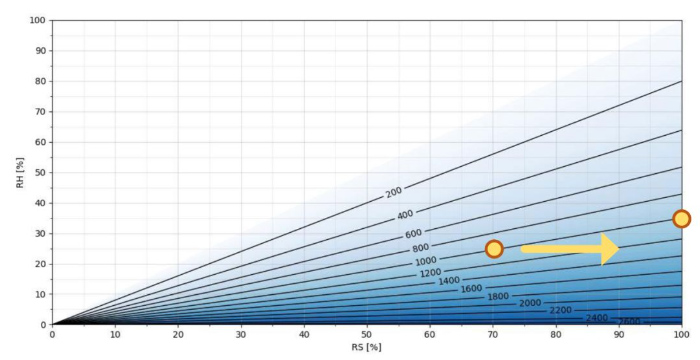
Figure 2. H2O2 ppm as a function of RS/RH at T = 25 °C
Figure 2 shows you H2O2 ppm as a function of relative saturation and relative humidity at 25 °C. Relative saturation is on the x axis and relative humidity is on the y axis. Darker shading shows higher ppm of H2O2. As you can see, the more hydrogen peroxide in the air mixture, the greater the difference between relative saturation and relative humidity values. For example, at 25 °C and1000 ppm hydrogen peroxide, the humidity level 25%RH is equivalent to 70% RS. When this gas mixture with 1000 ppm hydrogen peroxide starts to condense (relative saturation being 100%), relative humidity is 35%.
Temperature affects how much hydrogen peroxide can be in the air before condensation (relative saturation equals 100% RS). Thus, the graph on Figure 2 changes when temperature changes.
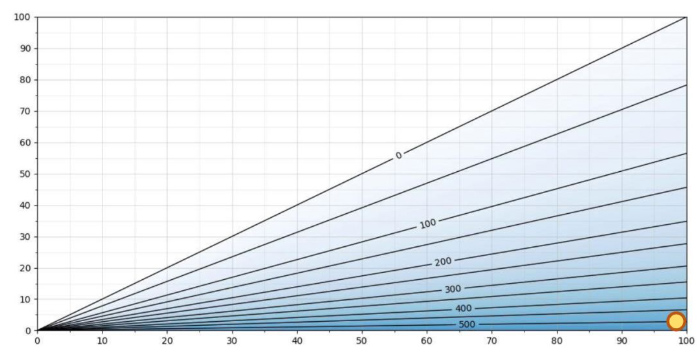
Figure 3. H2O2 ppm as a function of RS/RH at T = 5 °C
Figure 3 shows same graph at 5°C. The maximum H2O2ppm level at 5°C is slightly above 500 ppm. As an example, at 5°C, 500ppm hydrogen peroxide and Relative Saturation 100 %RS, the relative humidity is approximately 2 %RH. As the relative saturation is 100 %RS, the air mixture will condense. The difference between %RS and %RH at this temperature is enormous: 100 %RS vs. 2 %RH. Measuring %RH in this particular case is of no real value.
The higher the temperature, the more H2O2 ppm can be added to the air mixture before condensation, as seen in Figures 4 and 5. In Figure4, at a temperature of 50 degrees Celsius, an H2O2 concentration of >12000 ppm can be achieved.
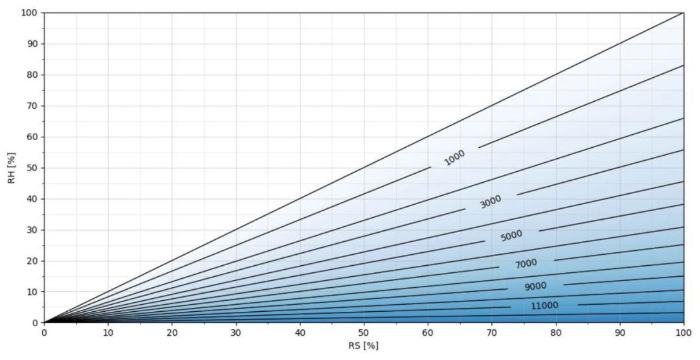 Figure 4. H2O2 ppm as a function of RS/RH at T = 50 °C
Each point in Figure 5 represents a condensation point, I.E. relative saturation is 100 %RS. Temperature is on the x axis and H2O2 ppm is on the y axis. The curves show the maximum relative humidity. As an example, at 20 °C and 300 ppm hydrogen peroxide, 60%RH is equivalent to 100%RS. If we increase air temperature to 40°C with an H2O2 concentration at 300 ppm, relative humidity will be 87% and relative saturation will be 100%. Condensation occurs at a relative humidity of<100% because of the relationship between air temperature and H2O2 concentration. Therefore the higher the temperature, the higher the maximum RH%. If we increase the hydrogen peroxide level from300ppm to 900 ppm at 40 °C, then the maximum achievable relative humidity decreases from87%RHto 70 %RH. The higher the ppm concentration, the lower the maximum %RH.
![]()
Figure 5. The x axis = temperature, y axis = ppm concentration.
Maximum achievable Relative Humidity (RS = 100 %RS)
These figures illustrate why it is insufficient to look only at relative humidity in bio-decontamination processes that use vaporized hydrogen peroxide. Air that is infused with H2O2 will condense at <100%relative humidity, depending on the temperature of the air and the concentration of hydrogen peroxide. When the air mixture contains vaporized H2O2, relative humidity can never reach 100% making it nearly impossible to accurately estimate when condensation will occur. The greater the temperature, the greater the allowable relative humidity. On the other hand, the higher the H2O2 concentration, the lower is maximum achievable RH.
When performing bio-decontamination with vaporized hydrogen peroxide, relative saturation is the only parameter that accurately represents the true saturation level; that is, the point at which you can expect condensation to occur.
